
The Delulu Blog
I Built a Dashboardfor My AI Coding Tools

I have more than one AI coding tool open on a normal day. That is not a flex. It is mostly an accounting problem with better autocomplete.
Claude might be working through a design problem, Codex might be fixing a stubborn implementation detail, Cursor might be sitting quietly in another project, and Git is the only thing nearby that can prove a change happened. Each surface has its own sessions, its own settings, its own idea of a project, and its own blind spots. None of them naturally answer the simple question: what did it take to build this thing?
Project first, because that is how the work actually feels
A token dashboard starts with a provider. A skill manager starts with a folder. A Git dashboard starts with commits. Those are all useful pieces, but they make the developer assemble the story in their head.
The dashboard starts with the filesystem project when possible, then connects observable Git repositories, agent sessions, capabilities, output, and activity around it. The goal is not to turn development into a leaderboard. It is to make a messy multi-agent working day legible before it becomes archaeology.
- Projects keep a local pin, status, and private note so the next open window has some memory of where work stopped.
- Agents remain distinct from their host environments. Claude in VS Code is not the same category as Claude in a terminal, and neither should be confused with the editor itself.
- Capabilities group recognisable installed things: skills, tools, integrations, automations, and instructions, rather than treating every command fragment as a separate product.
- Maintenance explains what deserves attention, why it matters, and what a safe next step could be. It does not quietly remove anything.
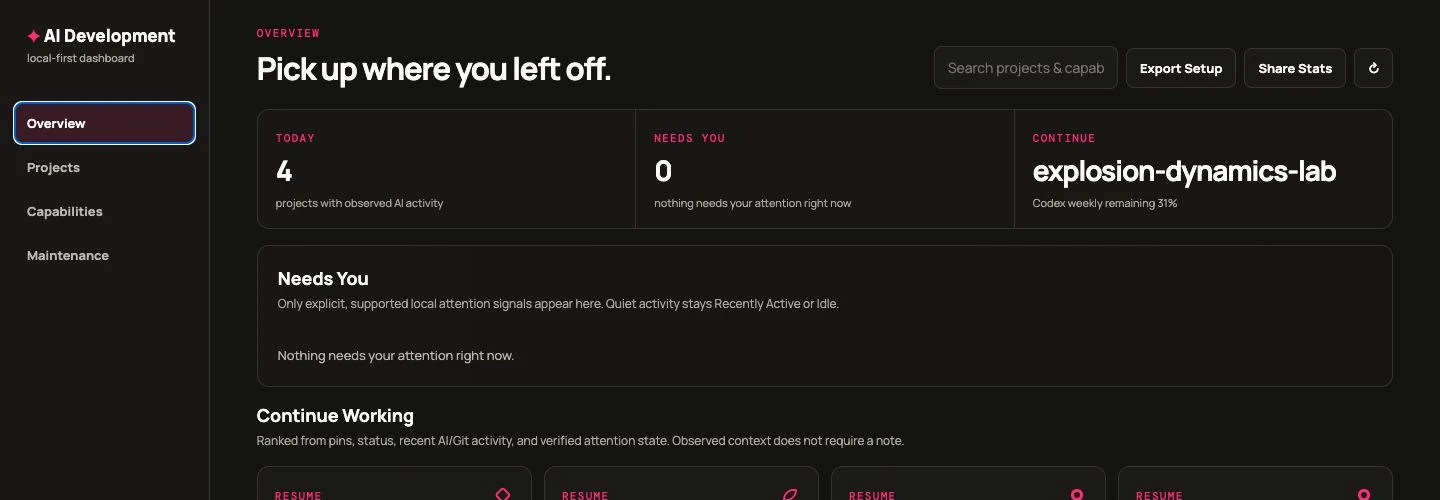
It also works as a compact operator layer rather than a sentimental event feed: recent projects show where work was left, the last observed agent, Git state, and a private note. A project handoff opens the same project in Claude, Codex, or Cursor without proxying an inference request, moving a subscription, or copying a private transcript between providers. The Needs You cue is deliberately stricter than “the session went quiet”: it appears only when an adapter has positive, structured evidence that a current task completed and is awaiting the next instruction. Otherwise the honest labels are Recently Active or Idle.
What the live screen is actually showing
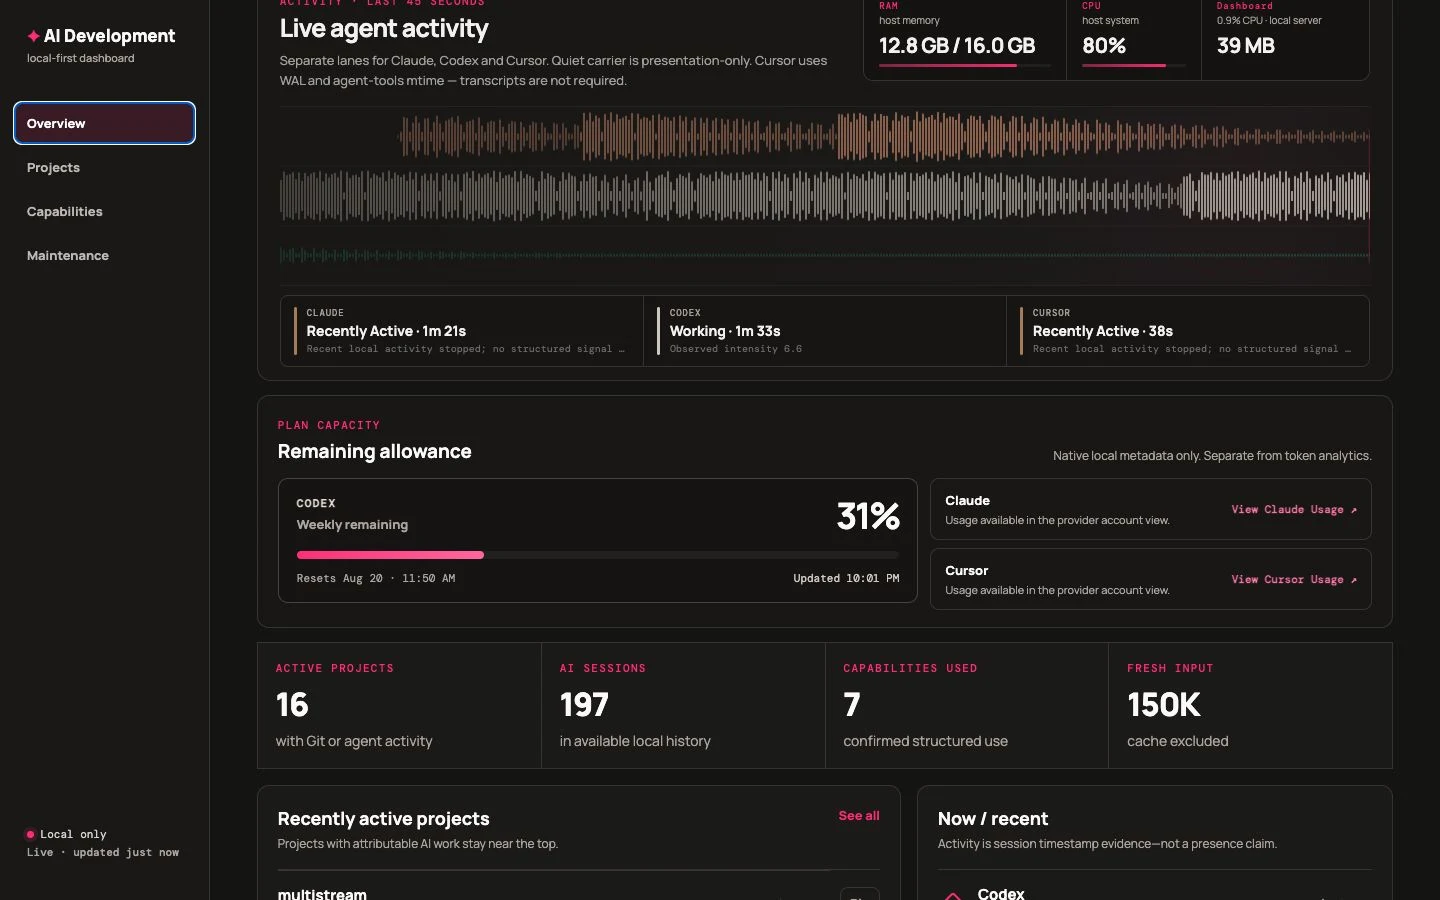
The live monitor is intentionally not called compute, effort, or utilisation. It is observed local agent activity. A trace responds to real local signals such as supported session/transcript updates and tool or command events. The display amplifies those real impulses into a denser signal field so an active agent is visible from another window; a presentation-only idle carrier keeps the instrument alive without pretending idle work exists.
That distinction matters. A local client can show that something changed locally. It cannot honestly tell me how hard a remote model was thinking, or turn a subscription percentage into a bill. The dashboard also keeps RAM, CPU, dashboard footprint, and plan capacity in their own lanes. Browser memory is not AI activity. Cache reads are not fresh input. It is amazing how much bad analytics disappears once you refuse to combine unlike things.
The useful inventory is bigger than a list of skills
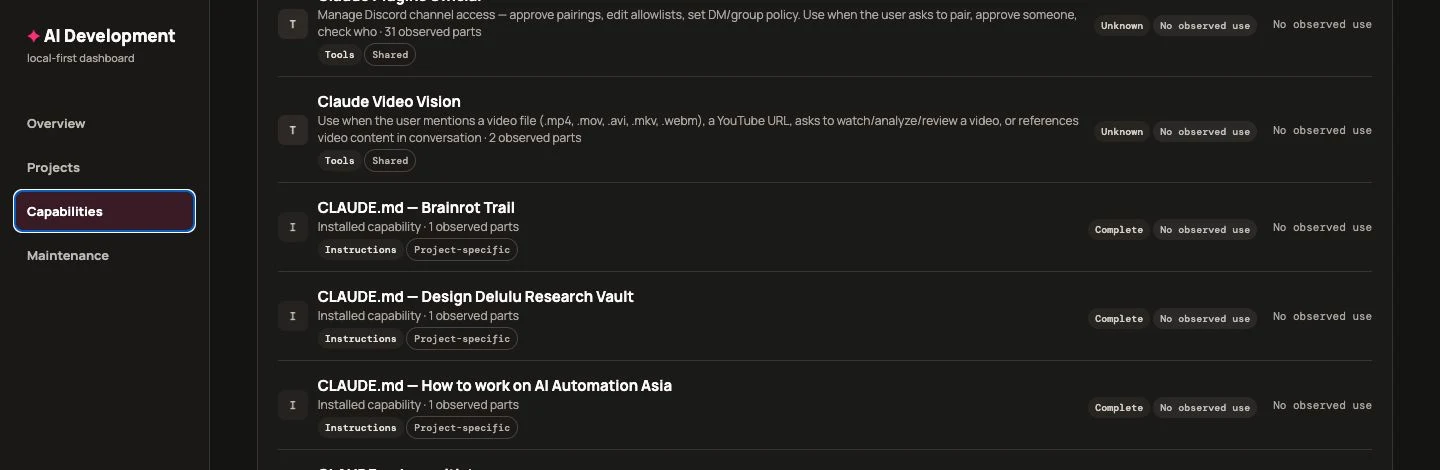
“Installed” and “used” are not the same status. The capability registry records compact metadata and usage evidence without copying private source files or conversations into a new database. It can distinguish a portable skill from a project instruction, an integration from an automation, and an intact installation from uncertain coverage in another agent.
One example is native Claude Auto-Compact. If the supported local setting is enabled, it appears as an Automation: Claude-specific, user/global in scope, active because the native configuration says so, and described as a behaviour rather than a magic new skill. That is the level of specificity I want from this product. Useful, but not fictional.
Token awareness without the performance theatre
There is a strong temptation to make the largest token number the headline. It is usually the least useful one. Claude’s local records can expose categories with very different meanings: fresh input, output, cache read, and cache creation. The dashboard preserves those distinctions. It does not call a giant cache-read field “tokens used” and quietly imply fresh consumption or subscription cost.
Where the underlying evidence allows a comparable period, the dashboard can show components such as tokens per session or cache ratio. It does not invent a universal productivity score, and it does not claim tokens per completed task when completed-task attribution is not solid enough. More tokens and more lines of code are both perfectly capable of describing a worse outcome.
Share Stats is a recap, not a screenshot of a settings page
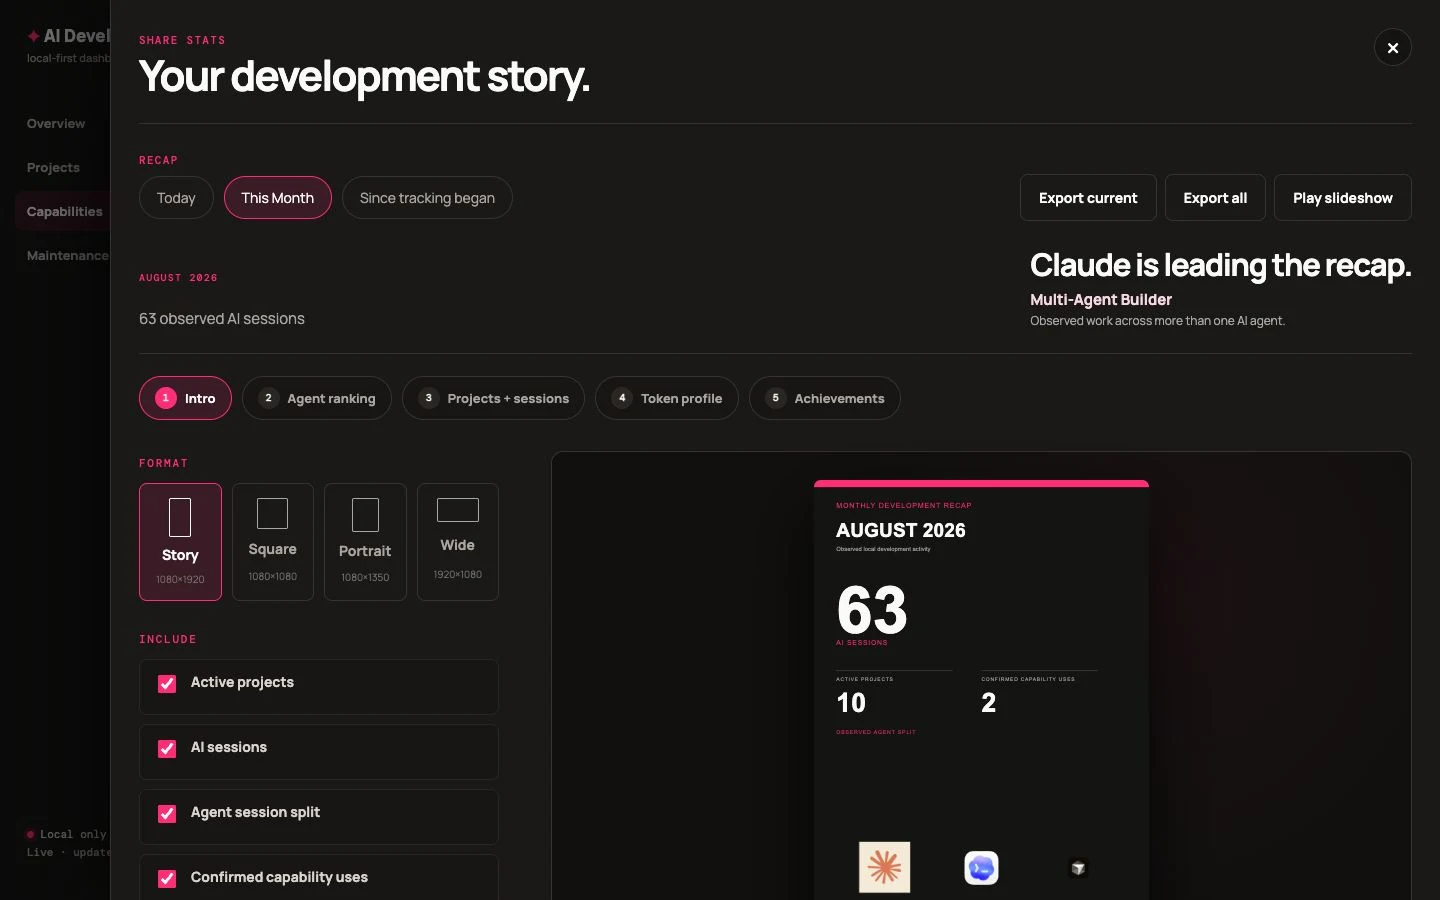
The share workspace turns only public-safe, supported values into an editable story. A monthly recap can become a short local slide deck: an intro, agent rankings, projects and sessions, a token profile when real categories exist, capability usage, and deterministic achievements. Today and “Since tracking began” use different compositions because they answer different questions.
The ranking slide makes the encoding explicit: every agent has a recognisable mark, name, rank, count, percentage, and proportional bar. A tiny provider does not disappear because a scaled logo became microscopic. An agent with no observed sessions in the selected period is labelled as such instead of quietly ranked as a loser.
Achievements are deliberately boring in the right way. Multi-agent use, consistent observed activity, healthy capability use, and improvement against a personal baseline can qualify. Maximum token burn, maximum generated LOC, and maximum prompt count do not. The system has visual tiers and replaceable badge slots, but the rule comes before the badge.
Local-first is not a decorative privacy claim
The dashboard stores references, hashes, compact summaries, normalised events, and derived analytics where they are needed. It does not upload code, raw sessions, prompts, credentials, environment values, or private paths. Public exports run through a central privacy classification. Project notes are local-only by default. A share snapshot freezes the exact selected metric values and definitions so a later scan cannot silently rewrite a card someone already exported.
That makes setup export more useful too. A Share Stack and machine-readable manifest describe safe capability metadata. The generated Setup Prompt tells another agent to audit the target machine first, identify duplicates and conflicts, preserve working configuration, and propose only appropriate changes. It is a safer handoff than “copy every config file and hope.”
What is still missing, on purpose
The app cannot prove everything. Some agent records do not expose project attribution. Some providers do not expose supported local plan capacity. Historical VS Code AI usage is only counted if extension-specific evidence genuinely represents AI-assisted development; ordinary editor activity is not retroactively rebranded as AI work. Update checks, import, routing recommendations, and capability removal all need stronger ownership and compatibility evidence before they should become buttons.
Eventually I want the dashboard to be able to say something genuinely useful, such as “this kind of debugging has historically been leaner in one agent for you.” That requires personal, comparable evidence, not generic model discourse, and definitely not a covert subscription router.
Research Confidence
This article is based on:
- Direct design, implementation, and ongoing owner use of AI Development Dashboard as a local developer utility
- A real local dashboard screenshot captured while observed Claude, Codex, and Cursor activity was visible, with private project names, paths, prompts, and notes intentionally excluded
- Read-only inspection of supported local agent, Git, capability, and system data sources, with unavailable sources represented as unavailable
- Product decisions that deliberately separate measured values, cautious inference, and unknown data rather than presenting a complete-looking fiction
Confidence Level: Experimental
FAQ
What is AI Development Dashboard?
AI Development Dashboard is a local-first developer utility that organizes observable Claude, Codex, Cursor, Git, project, and capability data around the projects being built. It is an evolving private project, not a public service or an official provider dashboard.
Does it upload code or conversations?
No. The dashboard is designed to index compact local metadata and derived analytics. It does not upload code, raw conversations, prompts, credentials, or private paths.
Does it measure model compute or subscription cost?
No. The live monitor labels observed local activity, not model compute or effort. Subscription capacity appears only when a supported local source exposes it, and token categories are kept separate from estimated billing.
Why is the dashboard organized by project?
A developer normally wants to know what it took to build a project: which agents, sessions, capabilities, context activity, and code changes were involved. Provider-first telemetry does not answer that as well.
Is AI Development Dashboard publicly available?
Not yet. It is an evolving private project. A public release needs a final privacy audit, license decision, documentation review, and clean release history first.
Need a system that earns its place?
We build practical growth infrastructure around the job that matters, not a decorative pile of tools.
Free Marketing AuditOr book a strategy call