Complete Analytics & Measurement Guide for Property Management Companies: Track What Matters
by Design Delulu Editorial · October 30, 2025
Smart, fast, and measurable. Here's how analytics & measurement helps Property Management win.
Property management success depends on understanding which marketing channels fill vacancies fastest, which tenant acquisition campaigns deliver the best ROI, and how prospects move through your leasing funnel. Without proper analytics infrastructure, you're making million-dollar decisions based on incomplete data—or worse, gut feelings that cost you occupancy rates and revenue.
The property management landscape has shifted dramatically. Today's prospects research properties across multiple touchpoints before scheduling a showing. They compare amenities on your website, read reviews on Google, check social media for community vibes, and browse listing platforms simultaneously. Traditional analytics setups miss 40-60% of this cross-channel behavior, leaving property managers blind to what actually drives lease signings. Modern analytics infrastructure captures the complete tenant journey, attributes revenue to the right channels, and gives you actionable insights that directly impact your bottom line.

Why Property Management Needs Advanced Analytics Infrastructure
Property management operates in a high-stakes environment where vacancy costs compound daily and acquisition costs continue rising. Every week a unit sits empty represents permanent revenue loss. Yet most property management companies rely on fragmented data from listing platforms, website analytics, and CRM systems that don't communicate with each other.
This fragmentation creates critical blind spots:
- Attribution gaps: You can't identify which marketing dollar generated which lease, making budget optimization impossible
- Channel performance mysteries: Paid ads, organic search, referrals, and listing platforms all claim credit without unified tracking
- Conversion funnel leaks: Prospects drop off between website visits and tour bookings, but you don't know where or why
- ROI uncertainty: Marketing spend increases but you lack concrete proof of which campaigns actually fill units
- Seasonal pattern blindness: Without year-over-year tracking, you can't anticipate demand shifts or optimize pricing strategies
Professional analytics infrastructure solves these problems by creating a single source of truth that tracks every touchpoint from initial awareness through lease signing. When implemented correctly, you gain visibility into prospect behavior patterns, accurately attribute leases to marketing sources, and identify optimization opportunities that directly reduce vacancy rates.
Core Components of Property Management Analytics
Effective analytics for property management requires four interconnected systems working together seamlessly. Each component plays a specific role in capturing, processing, and surfacing the insights you need to make confident decisions.
Event Tracking & Data Collection
Modern property management analytics starts with comprehensive event tracking that captures every meaningful interaction across your digital properties. This goes far beyond basic pageview counting to include:
- Property search filters and preferences (location, price range, amenities, pet policies)
- Virtual tour initiations and completion rates for each property
- Photo gallery engagement and time spent viewing specific units
- Application form starts, abandonment points, and completion rates
- Tour scheduling interactions, cancellations, and rescheduling patterns
- Document downloads (brochures, lease agreements, community guides)
- Chat widget interactions and question categories
- Video content engagement (property walkthroughs, neighborhood highlights)
- Comparison tool usage showing which properties prospects evaluate together
We implement this through Google Analytics 4 with server-side tagging, which provides several critical advantages over traditional client-side tracking. Server-side implementation bypasses ad blockers that prevent 20-30% of tracking data, ensures consistent data collection even when browsers block cookies, and gives you complete control over what data gets sent to third-party platforms.
Attribution Modeling That Matches Your Funnel
Property management has a unique consideration cycle where prospects typically interact with your brand 8-12 times before scheduling a tour. Standard last-click attribution dramatically undervalues the awareness and consideration touchpoints that initiate the journey.
We build custom attribution models that reflect property management realities:
- Position-based models: Credit first touch (awareness) and last touch (conversion) heavily while acknowledging middle interactions
- Time-decay models: Give more weight to recent interactions as prospects move closer to lease decisions
- Custom weighted models: Assign attribution percentages based on your specific funnel data and channel performance
- Data-driven attribution: Use machine learning to identify which touchpoint combinations most strongly predict lease signings
Proper attribution reveals which channels initiate high-quality leads versus which channels close deals. You might discover that SEO content drives initial awareness for 70% of quality prospects, while paid search captures high-intent searchers ready to tour immediately. This insight lets you allocate budget strategically rather than over-investing in the last channel prospects touched.
Source-of-Truth Dashboards
Raw data becomes actionable only when visualized effectively. We create Looker Studio dashboards that consolidate data from GA4, your property management software, CRM, advertising platforms, and listing services into unified views that answer your most important questions instantly.
Executive dashboards provide high-level performance monitoring:
- Vacancy rates by property with month-over-month trends
- Cost per lease by channel and campaign
- Average time to lease with funnel stage breakdowns
- Marketing ROI with year-over-year comparisons
- Lead quality scores and conversion rate trends
Operational dashboards empower daily decision-making:
- Real-time lead volume by source with quality indicators
- Website conversion funnel with specific drop-off identification
- Property-level performance showing which units attract the most interest
- Content performance revealing which pages drive tour bookings
- Campaign performance tracking with budget pacing alerts
These dashboards update automatically, eliminating manual report compilation and ensuring your team always works from current data. Automated alerts notify you when key metrics fall outside expected ranges, enabling rapid response to emerging issues.

Data Governance & Quality Assurance
Analytics infrastructure degrades over time without proper governance. Website updates break tracking tags, new campaigns launch without proper UTM parameters, and team members create duplicate goals that muddy reporting. We implement comprehensive governance frameworks that maintain data quality long-term:
- Naming conventions: Standardized campaign, source, and medium taxonomy that everyone follows
- Tag management protocols: Version control and testing requirements before deploying new tracking
- Data validation rules: Automated checks that flag inconsistencies and anomalies
- Documentation systems: Central repository explaining what each metric measures and how it's calculated
- Access controls: Role-based permissions preventing accidental configuration changes
- Regular audits: Quarterly reviews identifying drift and optimization opportunities
Implementation Process: From Discovery to Optimization
Building effective analytics infrastructure requires systematic execution across four distinct phases. Each phase builds on the previous one, creating compounding value as your measurement capabilities mature.
Phase 1: Discovery & Goals Definition
We start by understanding your business model, competitive position, and growth objectives. This discovery process clarifies:
- Revenue model specifics: Average lease value, typical lease duration, renewal rates, and lifetime tenant value
- Marketing funnel stages: How prospects move from awareness through consideration to lease signing
- Current data landscape: Existing tools, integration capabilities, and historical data availability
- Key stakeholder needs: What insights executives, marketing teams, and property managers need daily
- Success metrics: Quantifiable KPIs that will prove ROI and guide optimization decisions
- Technical constraints: Platform limitations, budget boundaries, and timeline requirements
This phase typically takes 1-2 weeks and concludes with a documented measurement strategy that everyone agrees will drive business impact.
Phase 2: Blueprint & Measurement Plan
With goals clarified, we design the complete analytics architecture before building anything. The blueprint includes:
- Tracking specification: Detailed event taxonomy defining every interaction we'll measure
- Data layer structure: Technical framework for passing information from your website to analytics platforms
- Integration mapping: How data flows between your property management system, CRM, advertising platforms, and analytics
- Attribution model design: Mathematical framework for credit allocation across touchpoints
- Dashboard wireframes: Visual mockups showing exactly what insights you'll access and how
- Governance protocols: Rules, processes, and documentation standards for maintaining quality
This blueprint phase prevents expensive rebuilds by catching issues before implementation begins. It typically requires 2-3 weeks and produces documentation that guides development and serves as ongoing reference material.
Phase 3: Build, Test & Launch
Implementation transforms blueprints into working systems through careful staged deployment:
Technical setup (Week 1-2):
- Configure Google Analytics 4 property with custom dimensions and metrics
- Implement server-side tag management for reliable data collection
- Deploy event tracking across website, virtual tours, and application flows
- Set up conversion tracking for key goals (tour bookings, applications, lease signings)
- Configure cross-domain tracking for properties on separate domains
Integration & testing (Week 2-3):
- Connect property management software for occupancy and lease data
- Integrate CRM to track lead progression and conversion rates
- Link advertising platforms for complete channel performance visibility
- Execute comprehensive QA testing across devices, browsers, and user flows
- Validate data accuracy by comparing against known baseline metrics
Dashboard deployment (Week 3-4):
- Build Looker Studio dashboards with real data flowing through
- Configure automated email reports for key stakeholders
- Set up alerts for critical metric changes requiring immediate attention
- Create documentation explaining how to interpret each visualization
- Conduct training sessions ensuring your team can access and use insights
We deploy incrementally, validating each component before moving forward, ensuring you get reliable data from day one rather than discovering issues weeks later.
Phase 4: Optimization & Iteration
Analytics infrastructure provides maximum value when insights drive continuous improvement. We establish optimization rhythms that turn data into action:
Weekly tactical reviews: Quick sessions identifying immediate opportunities like underperforming ads, high-bounce landing pages, or conversion funnel bottlenecks that can be fixed within days.
Monthly strategic analysis: Deeper dives into channel performance, seasonal patterns, and competitive positioning that inform bigger marketing decisions and budget reallocations.
Quarterly roadmap updates: Major reviews assessing whether tracking captures all relevant behaviors, dashboards answer current questions, and attribution models reflect evolving funnel dynamics.
This optimization phase never truly ends. As your property portfolio grows, market conditions shift, and new marketing channels emerge, your analytics infrastructure evolves to maintain relevance and accuracy.
Deliverables: What You Actually Receive
Our analytics engagements produce tangible assets that drive immediate value and support long-term success:
Comprehensive Tracking Plan
A detailed document specifying every event, parameter, and custom dimension your analytics implementation captures. This serves as both implementation guide and ongoing reference, ensuring anyone on your team understands exactly what data gets collected and why. Includes event triggers, data structure definitions, and example use cases demonstrating how each metric supports decision-making.
GA4 & Server-Side Configuration
Fully configured Google Analytics 4 property with server-side tag management deployed and validated. This includes custom event taxonomy tailored to property management workflows, enhanced measurement for scroll depth and video engagement, conversion tracking for all key goals, cross-domain tracking when needed, and data retention settings optimized for your reporting needs. You receive admin access with proper permission structures and complete documentation.
Production Dashboards
Multiple Looker Studio dashboards designed for different roles and use cases. Executive dashboards provide high-level KPI monitoring with automated weekly email delivery. Marketing dashboards break down channel performance, campaign effectiveness, and content engagement. Operations dashboards track real-time lead flow, conversion funnel performance, and property-level metrics. All dashboards include filters for date ranges, properties, channels, and campaigns enabling flexible analysis.
Attribution Model Configuration
Custom attribution model implemented in GA4 that accurately reflects your property management funnel. Includes documentation explaining the methodology, comparison reports showing how different attribution approaches would allocate credit, and recommendations for when to revisit model assumptions as your business evolves.
Governance Documentation
Operations manual covering naming conventions, UTM parameter standards, tag deployment protocols, QA testing checklists, and troubleshooting guides. This ensures your team can maintain analytics quality independently and onboard new members quickly without degrading data accuracy.
Best Practices for Property Management Analytics Success
Implementing analytics infrastructure represents just the starting point. Maximizing ROI requires following proven approaches that separate high-performing organizations from those with expensive analytics setups nobody uses.
Prioritize High-Impact Tracking First
Don't attempt to track everything immediately. Start with the 20% of interactions that drive 80% of insights: property searches, virtual tour completions, application starts, tour bookings, and lease signings. Get these foundational events tracking accurately before expanding to secondary behaviors like amenity filter usage or photo gallery engagement. This approach delivers quick wins that build stakeholder confidence while establishing infrastructure for future expansion.
Pair Creative With Measurement
Every marketing asset should have associated KPIs before launch. When creating new landing pages, define success metrics during design, not after deployment. When launching paid campaigns, establish tracking before spending begins. When producing property videos, identify engagement benchmarks that indicate effectiveness. This discipline prevents the common scenario where marketing runs for weeks before anyone realizes tracking wasn't implemented correctly.
Use Templates and Systems for Scalability
Property management companies managing multiple locations need scalable approaches. Create campaign templates with pre-configured tracking parameters so new property launches automatically include proper measurement. Build landing page templates with event tracking embedded rather than manually implementing tags for each new page. Establish UTM parameter conventions that property managers can apply consistently without technical knowledge.
Close the Loop With Regular Reviews
Analytics provide value only when insights drive action. Establish standing meetings where teams review performance data and commit to specific improvements. Weekly 30-minute sessions keep everyone aligned on current performance and surface quick optimization opportunities. Quarterly half-day reviews facilitate bigger strategic shifts based on accumulated learnings. Document decisions and track how data-driven changes impact results over time.
Maintain Single Source of Truth
Different tools inevitably report slightly different numbers due to methodology variations. Rather than constantly reconciling discrepancies, designate one system as authoritative for each metric category. GA4 becomes the source of truth for website behavior and marketing attribution. Your property management system remains authoritative for occupancy and lease data. Your CRM defines lead stages and quality scores. This eliminates endless debates about which numbers are "correct" and focuses attention on trends and actions.
Property Management-Specific Analytics Strategies
Property management has unique characteristics that require specialized analytics approaches beyond generic best practices.
Map Search Intent to Buyer Journey Stages
Prospects searching "apartments near me" exist in a fundamentally different mindset than those searching "luxury apartments downtown with pet spa." The first represents early awareness, the second indicates decision-stage intent. Track which keywords and content topics attract prospects at each funnel stage, then create targeted experiences matching their current needs. Early-stage prospects need neighborhood guides and amenity comparisons. Late-stage prospects need virtual tours, availability calendars, and easy application processes.
Deploy Social Proof Strategically Based on Data
Analytics reveal exactly when prospects need validation most. Track where hesitation occurs—maybe tour booking forms have 60% abandonment while property detail pages convert well. This signals prospects become uncertain during the commitment step. Deploy social proof elements (resident testimonials, occupancy rates, community awards) at these specific friction points rather than scattering them randomly throughout your site.
Segment Performance by Property Characteristics
Aggregate metrics hide important patterns. Break down analytics by property type (garden vs. high-rise), price tier, location, and target demographic. You might discover your marketing performs excellently for luxury properties but underperforms for workforce housing. Or that properties near universities convert younger demographics efficiently while downtown locations attract professionals better. These insights enable targeted optimization rather than one-size-fits-all approaches that improve averages while leaving specific segments underserved.
Track Seasonal Patterns for Predictive Planning
Property management has pronounced seasonality—summer moving peaks, winter slowdowns, back-to-school rushes near universities. Multi-year analytics data reveals these patterns precisely for your specific portfolio. Use historical trends to anticipate demand shifts months in advance, adjusting marketing spend and pricing strategies proactively rather than reactively. This forecasting capability becomes increasingly accurate as your analytics history grows.
Measure Competitive Position Continuously
Track not just your absolute performance but your competitive standing. Monitor search impression share for key terms, compare your website engagement metrics against industry benchmarks, and track how your pricing positions against comparable properties. This competitive context prevents the dangerous assumption that improving numbers mean you're winning when competitors might be improving faster.
Common Analytics Implementation Challenges
Understanding potential obstacles helps you prepare for smooth implementation:
Integration Complexity
Property management companies use diverse tech stacks—often including legacy property management systems with limited API capabilities. We navigate these challenges through flexible integration approaches, from direct API connections when available to CSV import workflows when necessary. The goal remains creating unified reporting even when underlying systems resist easy connection.
Data Privacy Compliance
Tracking prospect behavior requires careful attention to privacy regulations including GDPR, CCPA, and fair housing laws. Our implementations include proper consent management, data anonymization where appropriate, and configuration options that let you balance insight depth against privacy obligations. Server-side tagging provides additional control, ensuring only necessary data reaches third-party platforms.
Attribution Window Challenges
Property management consideration cycles can stretch across several months, especially for expensive luxury properties. Standard 30-day attribution windows miss early touchpoints that initiated the journey. We configure extended windows matching your typical lease cycle duration, ensuring credit flows to all meaningful interactions regardless of when they occurred.
Team Adoption Resistance
Analytics investments fail when teams don't embrace new tools. We combat this through role-specific training, simple dashboard designs that answer specific questions immediately, and quick wins that demonstrate value rapidly. When property managers see how analytics help them identify which marketing sources deliver quality leads, adoption follows naturally.
Measuring ROI: Proving Analytics Value
Analytics infrastructure represents a significant investment that must demonstrate clear returns. We track these impact metrics:
- Marketing efficiency gains: Cost per lease decreases as attribution identifies most effective channels
- Conversion rate improvements: Funnel optimization based on drop-off data increases application completion
- Time savings: Automated dashboards eliminate hours of manual report compilation weekly
- Decision confidence: Data-backed choices reduce expensive mistakes and increase successful bets
- Vacancy reduction: Faster identification of performance issues enables quicker corrective action
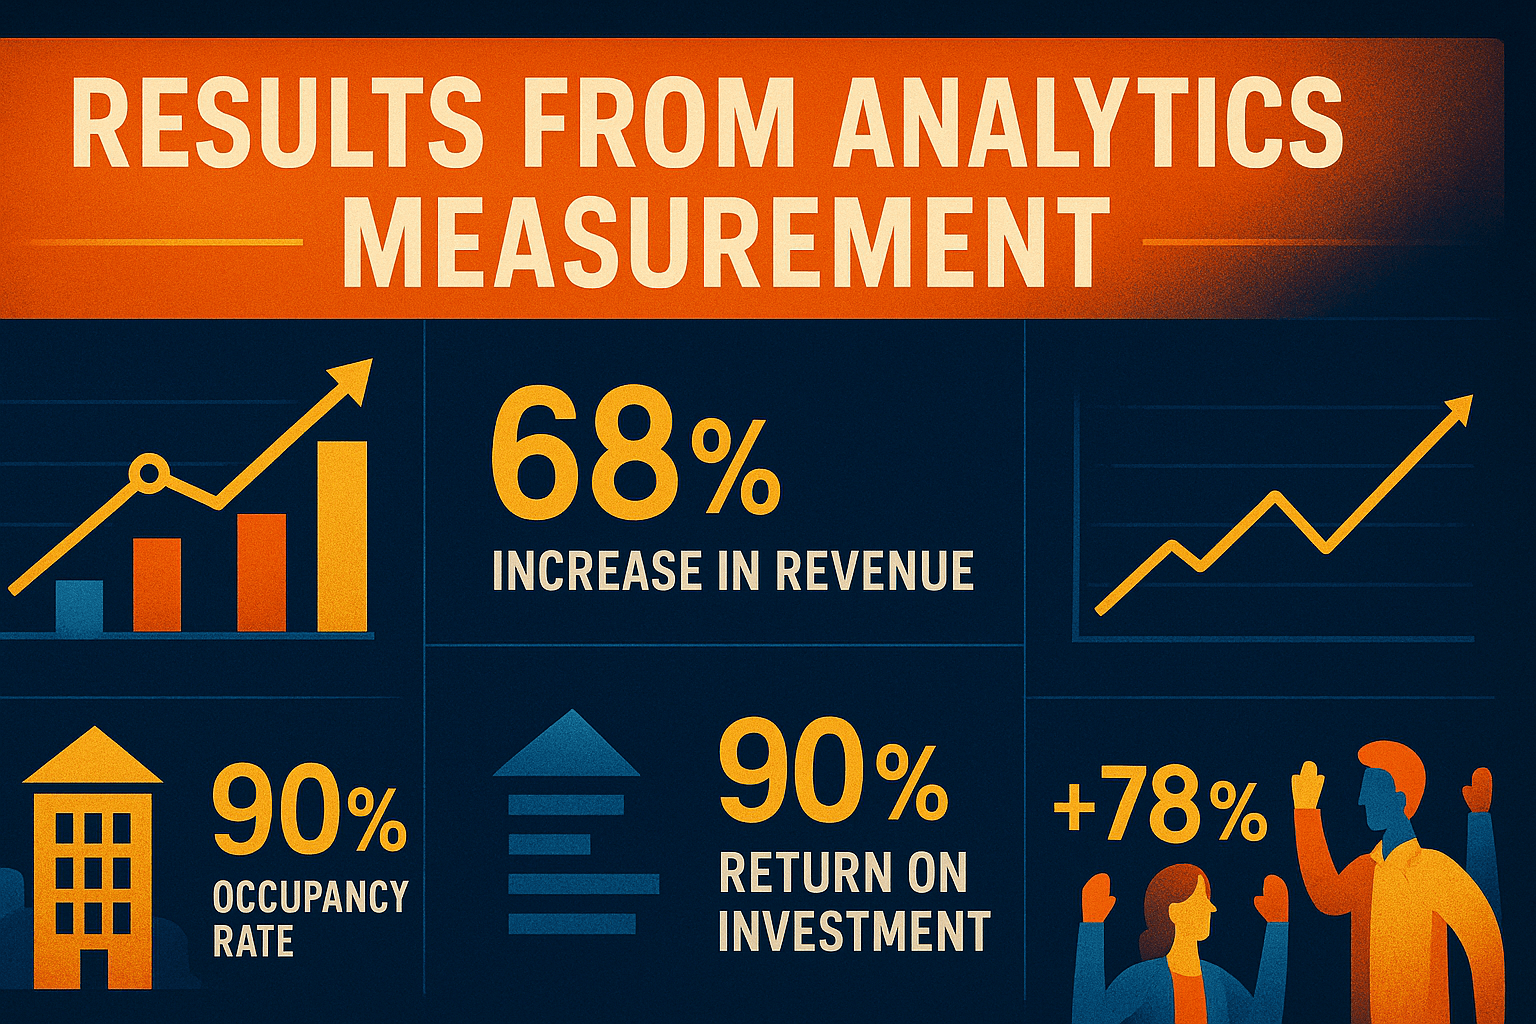
Most property management companies see 15-30% improvement in marketing ROI within the first six months after proper analytics implementation, driven primarily by channel optimization and conversion funnel improvements.
Getting Started: Next Steps for Property Managers
If you're ready to move beyond gut-feel decisions and build data-driven growth systems, here's how to begin:
Audit your current state: Document what analytics tools you currently use, what questions they answer well, and what critical gaps exist. Identify your most important unanswered questions about marketing performance, prospect behavior, and competitive position.
Define success metrics: Establish the specific KPIs that matter most for your business model and growth stage. Focus on metrics directly tied to revenue rather than vanity metrics that look impressive but don't drive decisions.
Assess resource requirements: Determine whether you have internal technical resources to support implementation or whether you need external expertise. Consider not just initial setup but ongoing maintenance and optimization needs.
Start with foundation: If current analytics infrastructure is minimal, begin with proper GA4 setup and basic dashboard creation before attempting advanced attribution modeling. Build capabilities progressively rather than attempting everything simultaneously.
Plan for optimization: Allocate resources for post-implementation iteration, not just initial setup. The biggest analytics ROI comes from continuously acting on insights rather than simply having pretty dashboards nobody uses.
Frequently Asked Questions
Let’s level up your Property Management business
Need services that actually move the needle for Property Management? See our approach, pricing, and timelines—then book a quick call.
Additional Resources
- Schedule Your Analytics Strategy Call
Book a 30-minute consultation to discuss your property management analytics needs, review your current measurement capabilities, identify gaps and opportunities, and explore how comprehensive tracking infrastructure can improve your marketing ROI and reduce vacancy rates.
- View Our Property Management Analytics Portfolio
Explore case studies and examples of analytics implementations we've delivered for property management companies, including dashboard designs, tracking strategies, and measurable results across different portfolio sizes and market segments.
- Free Property Management Marketing Tools
Access our collection of free tools designed for property managers including UTM parameter builders, conversion rate calculators, marketing budget templates, analytics audit checklists, and dashboard planning worksheets to jumpstart your data-driven marketing efforts.
Related Reading

Implement powerful analytics & measurement systems for e-learning & creators. Track student engagement, course performance, and revenue metrics with GA4, dashboards, and attribution modeling.

Transform construction contractor operations with expert analytics & measurement. Track project ROI, optimize bidding, and scale profitably with GA4, dashboards, and attribution modeling.

Turn restaurant data into revenue with GA4 tracking, custom dashboards, and attribution modeling. Get measurable results in 4-8 weeks with our proven framework.