Analytics & Measurement for Restaurants: Track What Actually Drives Revenue
by Design Delulu Editorial · October 11, 2025
In the restaurant industry, gut feelings and guesswork cost you thousands in wasted marketing spend every month. Without proper analytics and measurement systems, you're flying blind—unable to identify which channels drive reservations, what campaigns generate the highest-value customers, or where your budget is being burned with zero return. The difference between restaurants that scale profitably and those that struggle isn't the size of their marketing budget; it's the quality of their data infrastructure and their ability to act on insights quickly.
Modern restaurant analytics goes far beyond counting website visits or social media likes. It's about building a complete measurement ecosystem that tracks every customer touchpoint—from the first Instagram impression to the final reservation confirmation—and connects that data to actual revenue outcomes. When you implement server-side tracking with GA4, create single-source-of-truth dashboards, and establish attribution models that reflect your actual customer journey, you transform marketing from an expense into a predictable growth engine. The restaurants winning today aren't spending more; they're measuring smarter and moving faster based on real data, not assumptions.
Why Restaurant Analytics & Measurement Matters Now More Than Ever
The restaurant landscape has fundamentally changed. Third-party delivery platforms, reservation systems, social media marketing, paid search campaigns, influencer partnerships, email automation, and loyalty programs all generate massive amounts of customer data—but most restaurants can't connect these dots. You might know your Instagram engagement rate, but do you know which posts actually drive reservations? You can see your Google Ads spend, but can you track which keywords lead to high-value repeat customers versus one-time visitors?
This fragmentation creates three critical problems. First, you waste budget on channels and campaigns that feel like they're working but deliver minimal ROI. Second, you can't scale what's working because you don't have the data to prove causation versus correlation. Third, you make strategic decisions based on incomplete information, leading to missed opportunities and failed initiatives. The solution isn't more data—it's better measurement architecture that turns scattered metrics into actionable intelligence.
Effective analytics and measurement for restaurants requires a foundation built on accurate tracking, unified reporting, and attribution modeling that reflects how customers actually discover and choose your establishment. When implemented correctly, this system becomes your competitive advantage: you identify winning strategies faster, eliminate waste immediately, and compound growth consistently. The restaurants that invest in proper measurement infrastructure today will dominate their markets tomorrow, while competitors continue burning cash on untrackable marketing experiments.
The Complete Analytics & Measurement Framework for Restaurants
Building a high-performance measurement system for your restaurant requires four interconnected components working in harmony. Each element serves a specific purpose, and together they create a comprehensive view of how your marketing investments translate into business outcomes. Here's how we approach analytics and measurement to deliver maximum impact with minimum complexity.
Event Tracking & Data Collection Architecture
Everything starts with accurate data capture. We implement Google Analytics 4 with server-side tagging to ensure reliable tracking even as browser privacy restrictions tighten. This means tracking reservation form submissions, menu PDF downloads, phone number clicks, direction requests, online ordering events, email signups, and every other micro-conversion that indicates customer intent. We also integrate your reservation platform, POS system, and CRM to create a unified data layer that connects online behavior to offline revenue. The goal is complete visibility into every customer interaction across all channels and devices, with data governance protocols that keep information clean, consistent, and actionable.
Dashboards & Reporting Systems
Raw data without context is useless. We build custom Looker Studio dashboards that serve as your single source of truth—one place where you can see real-time performance across all marketing channels, campaigns, and customer segments. These dashboards answer your most important questions at a glance: Which marketing channels drive the most reservations? What's our customer acquisition cost by source? How do first-time visitors convert compared to returning customers? Which menu items or promotions generate the highest engagement? We design these reports for weekly decision-making, not monthly post-mortems, so you can adjust strategy and budget allocation in real time based on actual performance data.
Attribution Modeling & Customer Journey Analysis
Restaurant customer journeys are rarely linear. A diner might see your Instagram post, search for you on Google days later, read reviews on Yelp, visit your website multiple times, and finally make a reservation after receiving your promotional email. Standard last-click attribution gives all credit to that final email, completely ignoring the awareness and consideration touchpoints that made the conversion possible. We implement custom attribution models that accurately reflect your specific customer journey, ensuring marketing credit is distributed fairly across all contributing channels. This prevents you from over-investing in bottom-funnel tactics while starving the top-of-funnel awareness activities that feed your entire pipeline.
Governance, Quality Assurance & Optimization Protocols
Analytics systems degrade over time without active maintenance. Tags break when websites are updated, tracking parameters get stripped from URLs, new campaigns launch without proper tagging conventions, and data quality slowly erodes. We establish governance frameworks that include regular audits, automated quality checks, standardized naming conventions, and documentation that keeps your measurement infrastructure reliable long-term. We also implement continuous optimization processes—weekly performance reviews, monthly deep dives, and quarterly strategic resets—that ensure your analytics evolve with your business and continue delivering actionable insights as your marketing sophistication grows.
How We Implement Analytics & Measurement for Restaurants
Our implementation process is designed for speed and sustainability. We don't believe in six-month analytics projects that deliver dashboards nobody uses. Instead, we focus on rapid deployment of high-impact measurement systems that start generating insights within weeks, then iterate based on what you learn. Here's our proven four-phase approach.
Phase 1: Discovery & Goal Alignment
We begin by understanding your business model, customer journey, current marketing mix, and most critical business questions. What metrics actually matter to your profitability? Where are the biggest gaps in your current measurement? What decisions are you currently making blind that better data could inform? We audit your existing analytics setup, identify quick wins and long-term improvements, and align on success metrics that tie directly to revenue outcomes. This discovery phase typically takes one week and ensures we're building measurement systems that solve real business problems, not just creating pretty dashboards.
Phase 2: Blueprint & Architecture Design
With clear goals established, we design your complete measurement architecture. This includes your tracking plan (what events to capture and how), data layer specifications, dashboard wireframes, attribution model parameters, integration requirements, and governance protocols. We map every important customer interaction to specific tracking events, design dashboard views for different stakeholders (ownership, marketing team, operations), and establish the technical foundation for reliable data collection. This blueprint becomes your implementation roadmap and ongoing reference documentation. Blueprint development typically requires one to two weeks and involves collaborative feedback sessions to ensure alignment.
Phase 3: Implementation & Quality Assurance
Now we build. We implement Google Analytics 4 with server-side tagging, configure event tracking across your website and key systems, build your custom dashboards in Looker Studio, establish attribution modeling rules, integrate data sources, and deploy governance protocols. Throughout implementation, we conduct rigorous QA testing to verify data accuracy—checking event firing, validating data flow, testing across browsers and devices, and confirming dashboard calculations. We don't launch until everything is validated and verified. Implementation duration varies based on complexity but typically ranges from two to four weeks for most restaurant operations.
Phase 4: Optimization & Continuous Improvement
Analytics is not a one-time project; it's an ongoing practice. After launch, we enter continuous optimization mode. We monitor data quality, identify anomalies, refine tracking based on learnings, add new events and dimensions as needed, and train your team on dashboard interpretation and data-driven decision making. We establish weekly review rhythms where we analyze performance together, identify opportunities, and adjust strategy. We conduct monthly deep dives into specific questions or channels, and quarterly strategic reviews where we assess what's working, what's not, and where to focus next. This optimization phase is where the real value compounds as you develop increasingly sophisticated measurement capabilities.
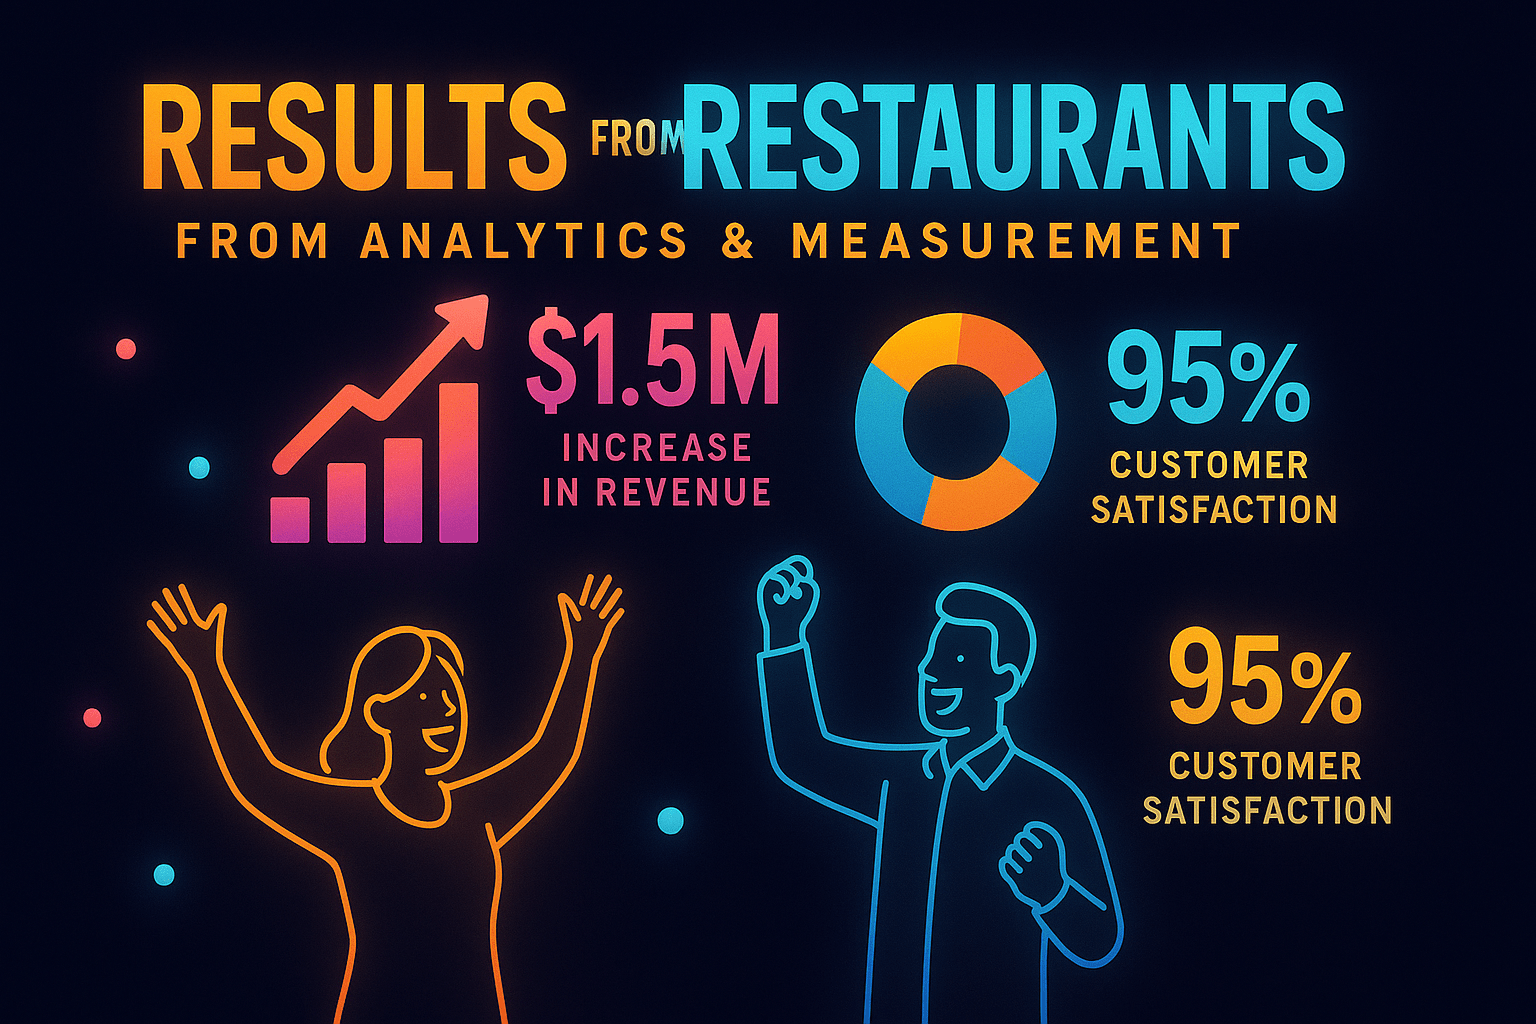
Best Practices for Restaurant Analytics Success
Successful analytics implementation isn't just about technical setup—it's about organizational adoption and smart prioritization. Here are the principles that separate restaurants that get value from their analytics from those that don't.
Start with your highest-impact pages and flows first. Don't try to track everything perfectly from day one. Identify the 20% of customer interactions that drive 80% of your revenue—likely your reservations flow, online ordering funnel, and key landing pages—and nail tracking for those first. You can always expand measurement coverage later, but getting core conversion tracking right immediately lets you start making better decisions fast.
Pair every creative asset with a measurable KPI. Whether it's a social media campaign, email blast, paid search ad, or website redesign, define success metrics upfront. What behavior are you trying to drive? How will you know if it worked? This forces clarity around campaign objectives and prevents the common trap of producing content that generates engagement but not business results. If you can't measure it, don't launch it.
Use templates and systems to scale quickly. Create standardized tracking parameter structures, dashboard templates, reporting formats, and campaign naming conventions. This consistency makes analysis dramatically faster and easier, reduces errors, and allows you to onboard new team members efficiently. The more systematic your measurement processes, the more time you have for actual analysis and optimization instead of data wrangling.
Close the loop with regular reviews and strategic resets. Data without action is worthless. Establish non-negotiable review rhythms—weekly tactical reviews of current campaign performance, monthly strategic analysis of channel mix and optimization opportunities, quarterly big-picture assessments of overall marketing effectiveness and budget allocation. These reviews are where insights become actions and where your measurement investment delivers ROI.
Restaurant-Specific Analytics Strategies That Work
Generic analytics approaches fail in the restaurant industry because they ignore the unique characteristics of how customers discover, evaluate, and choose dining establishments. Here's how to adapt your measurement strategy to restaurant-specific realities.
Map search intent to restaurant buyer stages precisely. Someone searching for 'best Italian restaurant Chicago' is in discovery mode with high consideration intent. Someone searching your restaurant name plus 'reservations' is ready to convert. Someone searching your name plus 'menu' or 'hours' is in evaluation mode. Track and optimize for each stage separately. Your measurement should distinguish between awareness (discovering you exist), consideration (evaluating if you're right for them), and conversion (ready to book). Different metrics matter at each stage, and your attribution model should reflect this journey.
Deploy social proof and outcome signals early in the customer journey. Restaurants are experience products—people can't truly evaluate quality until they've dined with you. This means trust signals (reviews, ratings, testimonials, media features, awards) disproportionately impact conversion. Track how exposure to social proof affects conversion rates. Measure the impact of review integrations on your website. Test whether featuring awards or press mentions on landing pages improves reservation rates. Your analytics should quantify the conversion lift from different trust-building elements.
Maintain a single source of truth dashboard for all stakeholders. Restaurant marketing often involves multiple team members, partners, or agencies running campaigns across different channels. Without unified reporting, everyone optimizes their silo while overall performance suffers. Your Looker Studio dashboard should be the one place everyone checks for performance data—no competing spreadsheets, no conflicting numbers, no ambiguity about what's working. This alignment is essential for effective budget allocation and strategic decision-making.
Embrace rapid iteration and compound wins. Restaurant marketing moves fast—new menu items, seasonal promotions, events, partnerships. Your analytics needs to support rapid testing and learning. Implement small changes, measure impact quickly, double down on what works, and kill what doesn't. The compounding effect of consistently making 5% better decisions every week far exceeds the impact of one big campaign swing. Your measurement infrastructure should enable this test-and-learn culture, not slow it down with complex analysis processes.
Common Analytics Mistakes Restaurants Make
Even restaurants that invest in analytics often fail to get value because they fall into predictable traps. Avoid these common mistakes and you'll be ahead of 90% of your competition.
Tracking vanity metrics instead of business outcomes. Social media followers, website traffic, email open rates—these metrics feel good but don't pay your rent. Focus your analytics on metrics that connect to revenue: reservation conversion rates, customer acquisition cost, lifetime value, return visit rates, average check size influenced by marketing. Vanity metrics can support these business metrics, but they should never be your primary success indicators.
Over-relying on platform-reported data. Facebook Ads Manager, Google Ads, Instagram Insights—every platform wants to take maximum credit for conversions. Their attribution is self-serving and often inflated. Use platform data for tactical campaign optimization, but make strategic budget decisions based on your own analytics infrastructure that tracks customers across all touchpoints with consistent methodology.
Ignoring data quality and letting tracking degrade. Analytics systems require maintenance. Broken tracking tags, missing URL parameters, inconsistent naming conventions, and integration failures slowly corrupt your data until insights become unreliable. Schedule regular audits, implement automated quality checks, and treat data infrastructure as a critical operational system that needs ongoing attention.
Building complex dashboards that nobody uses. More data doesn't mean better decisions. Many restaurants build elaborate dashboards with dozens of metrics that overwhelm rather than inform. Focus on clarity and actionability. Your weekly dashboard should answer five key questions about current performance. Your monthly dashboard should highlight three strategic opportunities. Simplicity drives adoption and action.
What's Included: Deliverables & Timeline
When you engage us for restaurant analytics and measurement, here's exactly what you receive and when you can expect results.
Comprehensive Tracking Plan: A detailed document specifying every event we'll track, the data we'll collect, how it maps to your business goals, and the technical implementation requirements. This becomes your measurement blueprint and ongoing reference.
Google Analytics 4 & Server-Side Tagging Setup: Complete GA4 implementation with server-side tag management for reliable tracking that's resistant to browser privacy changes. This includes event configuration, conversion tracking, audience building, and integration with your reservation and ordering systems.
Custom Looker Studio Dashboards: Purpose-built dashboards designed for your specific needs—weekly tactical performance views, monthly strategic analysis reports, and executive summaries. These connect to your GA4 data and any other relevant sources to provide unified reporting.
Attribution Model Configuration: Custom attribution settings that reflect your actual customer journey, ensuring marketing credit is distributed appropriately across all contributing touchpoints rather than oversimplifying with last-click attribution.
Documentation & Training: Complete documentation of your analytics setup, governance protocols, and how to interpret your dashboards. We also provide training sessions for your team to ensure everyone can access insights and make data-driven decisions independently.
Ongoing Optimization Support: Continuous monitoring, refinement, and enhancement of your analytics systems based on learnings, business changes, and new opportunities. This ensures your measurement capabilities evolve with your restaurant.
Timeline: Most restaurant analytics implementations are completed within 4-8 weeks from kickoff to full deployment, depending on complexity, integration requirements, and feedback cycles. You'll see initial insights within the first two weeks as core tracking goes live, with full capabilities and optimization processes established by week eight.
Frequently Asked Questions
Let’s level up your Restaurants business
Need services that actually move the needle for Restaurants? See our approach, pricing, and timelines—then book a quick call.
Additional Resources
- Schedule Your Analytics Strategy Call
Book a complimentary 30-minute consultation to discuss your current analytics challenges, explore measurement opportunities specific to your restaurant, and get a customized roadmap for implementation.
- View Our Restaurant Marketing Portfolio
Explore case studies and examples of successful analytics implementations, dashboard designs, and data-driven marketing campaigns we've delivered for restaurants across different segments and markets.
- Free Restaurant Marketing Tools
Access our collection of free calculators, templates, and resources including ROI calculators, tracking plan templates, dashboard examples, and measurement frameworks designed specifically for restaurant marketers.
Related Reading
Transform property management with advanced analytics. GA4 setup, attribution modeling, dashboards & tracking plans. 4-8 week implementation. See pricing & deliverables.
Implement powerful analytics & measurement systems for e-learning & creators. Track student engagement, course performance, and revenue metrics with GA4, dashboards, and attribution modeling.
